How to use one report to simulate many different reports in Tableau Software Using URL based report filters
Have you ever had a Regional Director who wanted their own Tableau report for just their region? Rather than build multiple reports, you can use URL filters to simulate the look of a custom report for each Region or Regional Director. For this exercise, we will use an existing Tableau report sample.
To view the Superstore Tableau Workbook Sample:
1. Open Tableau and go to File > New
2. From Sample Workbooks, choose “Superstore”


3. Click on the “Shipping” Dashboard from the Tableau tabs at the bottom of the workbook.

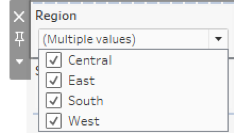
4. Notice the “Region” filter in the workbook.
To publish the report and get it ready to customize:
1. Publish the existing Tableau Report by going to Server > Publish Workbook
2 2. Under “Sheet Name”, uncheck every Sheet Name except, “Shipping”
and select “Publish”.

3. Once directed to the server, click on “Shipping” and notice that “All” Regions
are selected.
4 4. Click the “Share” button” and copy the “Link” text

To create the customize reports for each region including South, East, Central and West:
1. Take the link you copied and paste it into your URL browser window:
2. Add in the Region filter by typing “&Region=South” after “?:embed=y” and press enter.
Notice that the report now filters to only the South Region! This same process can be followed for all other Regions.
Comments
Post a Comment